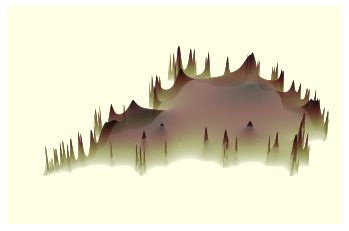
Egyszerű alakzatokból bonyolult alapzatok létrehozása.
---Python minta:
import numpy as np
from PIL import Image
import matplotlib.pyplot as plt
PIXEL_SCALE = 200
WIDTH = 3
HEIGHT = 3
XSTART = -2
YSTART = -1.5
image_width = int(PIXEL_SCALE*WIDTH)
image_height = int(PIXEL_SCALE*HEIGHT)
def create_color(v):
values = [0, 64, 128, 196]
b = values[v % 4]
g = values[(v//4) % 4]
r = values[(v//16) % 4]
return (r, g, b)
def calc(c1, c2):
x = y = 0
for i in range(1000):
x, y = x*x - y*y + c1, 2*x*y + c2
if x*x + y*y > 4:
return i+1
return 0
array = np.zeros((image_height,
image_width,
3),
dtype=np.uint8)
for i in range(image_width):
c1 = XSTART + i/PIXEL_SCALE
for j in range(image_height):
c2 = YSTART + j/PIXEL_SCALE
v = calc(c1, c2)
array[j, i,] = create_color(v)
img = Image.fromarray(array)
# img.save('mandelbrot-colour.png')
plt.imshow(img, cmap='hot')
plt.axis("off")
plt.show()
---Python minta:
import math
from random import randint
from collections import namedtuple
# const - upper limit for randint
s = 20
class Point(namedtuple('Point', 'x y')):
def __str__(self):
return'{} {}'.format(self.x, self.y)
def __add__(self, other):
assert isinstance(other, Point)
return Point(self.x + other.x, self.y + other.y)
def __mul__(self, other):
return Point(self.x * other, self.y * other)
def __rmul__(self, other):
return self.__mul__(other)
class Branch(namedtuple('Branch', 'p1 p2 color size')):
def __str__(self):
"""Path SVG object with points, color and stroke of branch."""
return ('<path d="M {p1} L {p2}" '
'stroke="rgb(100,{c},0)" stroke-width="{w}"/>\n'.
format(p1=self.p1, p2=self.p2, w=self.size, c=self.color))
def __repr__(self):
return self.__str__()
class Tree(object):
def __init__(self, length, angle, depth, point, size, color, outlist):
"""Main point of start generation."""
self.branches = outlist
self.draw_branches(length, angle, depth, point, size, color)
def draw_branches(self, length, angle, depth, p1, size, color):
""" Recursively generate three Branch objects per iteration."""
if depth <= 0:
return
p2 = p1 + length * Point(
math.cos(math.radians(angle)),
math.sin(math.radians(angle))
)
# set some new characteristics for the next level
branch_length = 2.0 / 3.0 * length
branch_size = 2.0 / 3.0 * size + 1
color += 6
# Calculate new angle and recurse
self.branches.append(Branch(p1, p2, color, branch_size))
nangle = angle + randint(-10, s)
self.draw_branches(branch_length, nangle, depth - 1,
p2, branch_size, color)
# Calculate new angle and recurse
b = Point(p1.x, p2.y)
self.branches.append(Branch(p1, b, color, branch_size))
nangle = angle + randint(-1, 0) * randint(1, s)
self.draw_branches(branch_length, nangle, depth - 1,
b, branch_size, color)
# Calculate new angle and recurse
c = Point(-p2.x + 2 * p1.x, p2.y)
self.branches.append(Branch(p1, c, color, branch_size))
nangle = angle + randint(0, 1) * randint(1, s)
self.draw_branches(branch_length, nangle, depth - 1,
c, branch_size, color)
def write_svg(self, output='kl_py_fractral_20.svg'):
with open(output, 'w') as outfile:
outfile.write('<svg xmlns="http://www.w3.org/2000/svg" '
'viewBox="0 0 800 800" version="1.1">\n')
outfile.writelines(map(str, self.branches))
outfile.write('</svg>\n')
resultlist = [Branch(Point(400, 800), Point(400, 600), color=60, size=35)]
t = Tree(length=200, angle=-20, depth=9, point=Point(400, 600), size=35, color=60, outlist=resultlist)
t.write_svg()


Megjegyzések
Megjegyzés küldése